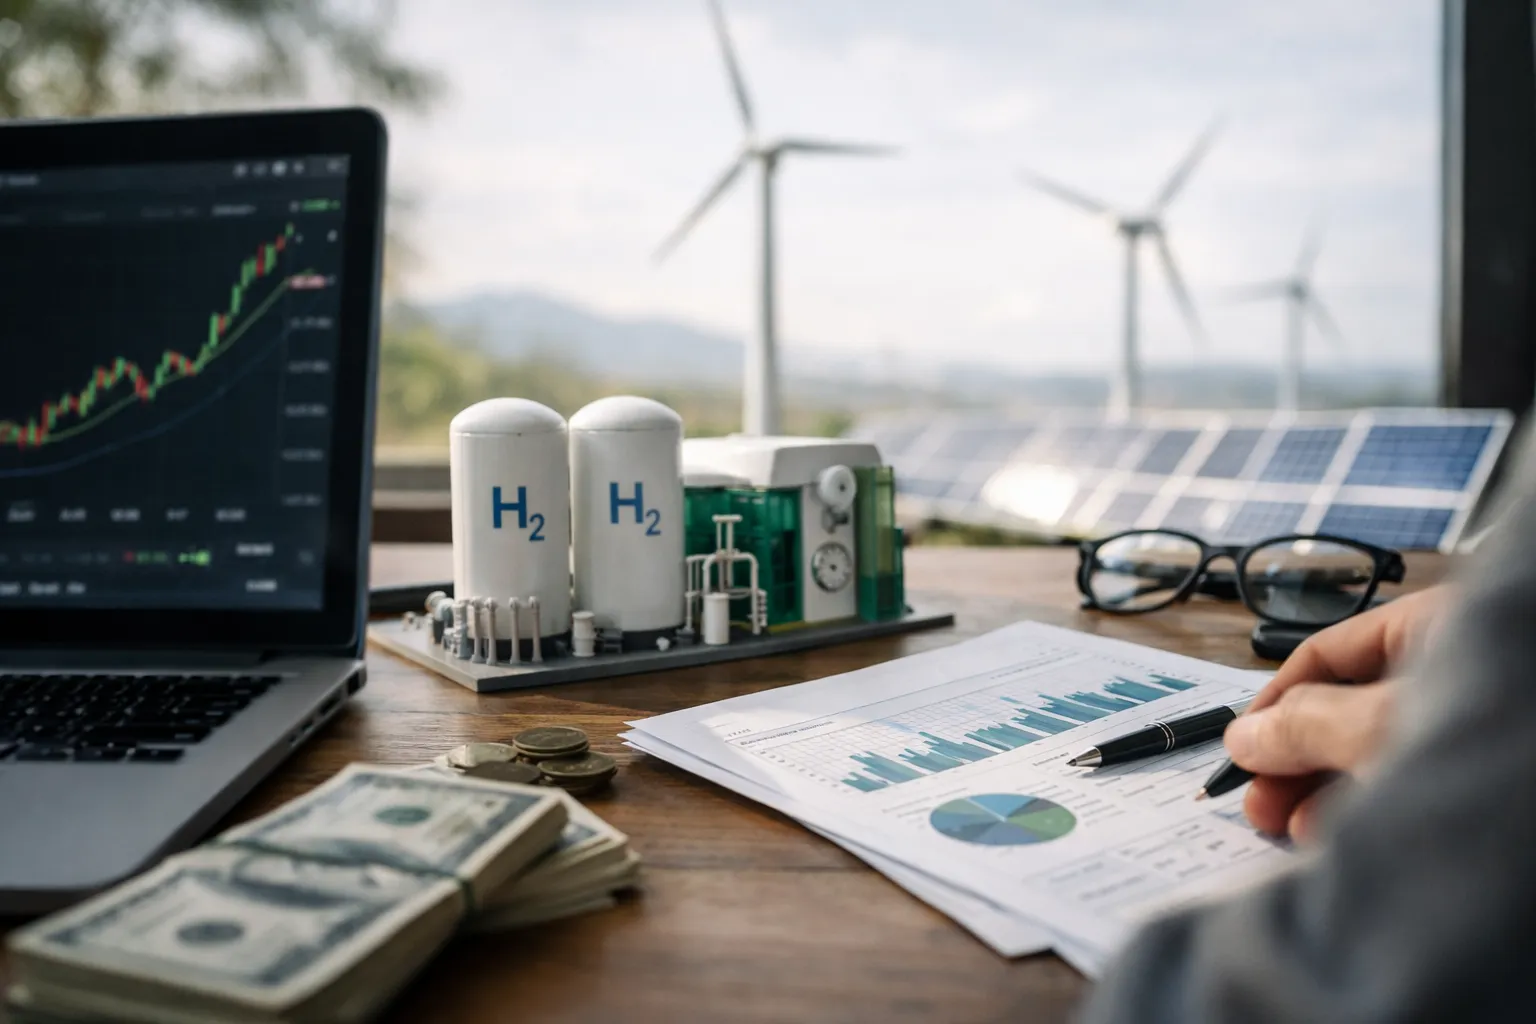
What you will learn: This update brings the original April 2026 10‑step due diligence checklist current to September 2026. It is written for retail and semi‑professional stock investors who want a repeatable framework to evaluate green hydrogen equities — electrolyzer makers, project developers, industrial incumbents and end‑users — in light of the most recent policy, technology and financing shifts.
Why this matters now: Between 2022 and 2026 the green hydrogen theme moved decisively from pilots to first‑of‑a‑kind commercial plants and larger auction programs. That transition reduced some execution risk but introduced new, real‑time variables investors must model: evolving subsidy rules, hourly power‑market integration, manufacturing scale dynamics and more disciplined project finance. This article updates the 10‑step process with practical checks and examples that reflect those developments.
Prerequisites / Context
Before you begin company‑level work, confirm you understand three contextual facts that matter for valuation and risk:
- Business model diversity: Green hydrogen exposure is not homogeneous. Electrolyzer manufacturers, project developers/offtakers, industrial gas incumbents, and end‑use converters each require different analysis and multiples.
- Policy & subsidies remain determinative: Many projects only stack economically with production/tax credits, auction awards or firmed renewable PPAs. Track the specific incentive that applies to a project rather than assuming generic “green” support.
- Power markets are the dominant cost driver: Electricity is typically the largest single operating expense for electrolysis. Hourly/seasonal price patterns, congestion, and ancillary‑service revenue (for flexible operation) materially change LCOH and offtake economics.
Step 1 — Start with the policy and incentive map (updated)
What’s new in 2026: policy instruments are transitioning from one‑off grants to structured production incentives and competitive auctions in major markets. Investors must map specific eligibility rules rather than assume a single “hydrogen subsidy”.
- Identify the exact incentive(s) a project can access: production tax credits (per‑kg), auctioned offtake support (contract for difference), investment grants, or concessional loans.
- Determine timing and performance conditions: some credits require lifecycle emissions testing, local content thresholds, or commissioning windows. These conditions can delay or disqualify payments.
- For cross‑border producers or exporters, map trade/CBAM and local carbon‑pricing exposure. For projects supplying EU customers, EU auction outcomes and ETS price trajectories directly affect realized cash flows.
Action: create a one‑page “policy map” per project listing the incentive type, unit basis (€/kg or $/kg or €/MWh equivalent), qualification dates and any conditional triggers (local content, electrolyzer vintage, grid connection window).
Step 2 — Identify revenue model and contract cadence (refined for 2026)
What’s changed: the market has more hybrid offtake structures — part long‑term fixed price, part hourly indexed to power+peak spreads. Developers increasingly sell optionality (flex services) to grid operators.
- Classify the revenue buckets: base contracted volume (firm offtake), indexed volume (hourly/seasonal), merchant sales and value‑added services (firming, ammonia conversion, hydrogen storage receipts).
- Quantify the split for the next 3–5 years and model the cash‑flow cadence (monthly, quarterly, per‑kg payments vs. capacity payments).
- Assess counterparty credit: long‑dated offtakes from blue‑chip utilities, refiners or chemical majors materially lower financing cost versus small private buyers.
Action: treat non‑firmed LOIs as contingent revenue; only convert to contracted cash flow when legally binding and financeable under typical bank covenants.
Step 3 — Model project economics: LCOH calculation (hourly and subsidy-aware)
Updating your LCOH now requires layering three dimensions: (1) CAPEX & efficiency, (2) hourly power price exposure, (3) subsidy/tax credit realization mechanics.
- Build an hourly production model for at least one representative year rather than using a single capacity factor. Use regional grid price curves (market data vendors or ISO/PX published prices).
- Inputs to include: electrolyzer CAPEX ($/kW), efficiency (kWh/kg), dynamic capacity factor (hourly), electricity price curve ($/MWh), O&M ($/kg or % CAPEX), stack replacement schedule, WACC and useful life.
- Model subsidy mechanics explicitly — e.g., a per‑kg tax credit that phases in after verification or a CfD that tops up to a strike price. If subsidy payments are retrospective, include timing and credit risk.
Action: run three scenarios — optimistic (low average power price and full subsidy realization), base, and stress (high power prices, delayed subsidy). Compare LCOH to likely contract strike prices and market hydrogen prices.
Step 4 — Inspect supply chain and technology risk (new supply‑chain realities)
Recent developments: manufacturing scale is shifting, and component concentration (stacks, power electronics, membranes) remains a strategic risk. Expect two practical checks:
- Supplier concentration: identify single‑source components and where vendors are located. Confirm lead times and contingency capacity if a supplier faces export controls or capacity constraints.
- Technology maturity and demonstrated lifetime: prefer vendors with multi‑MW commercial deployments and published degradation data under commercial operating profiles.
Action: seek third‑party test reports, warranty terms tied to degradation rates, and supply agreements that include price and delivery commitments. Be skeptical where claims rest only on lab/pilot results.
Step 5 — Examine balance sheet, funding path and project finance (tighter markets)
Project finance markets tightened through 2023–25; by 2026 banks are selective. Equity remains the primary dilution source for early developers; large projects now require a mix of sponsor equity, non‑recourse project debt and institutional capital.
- For manufacturers: check orderbook quality, gross margins, backlog conversion timelines and capital needed to scale factories. Verify committed machine‑tool financing if announced.
- For developers: confirm whether projects have reached financial close (non‑recourse debt), and whether offtakers have credit enhancers or parent guarantees.
- Assess contingent liabilities from JV partners and track record of sponsor delivery in similar projects.
Red flag: repeated bridge financing, aggressive revenue recognition for projects that have not reached financial close.
Step 6 — Revenue recognition, JVs and accounting nuances (practical checks)
Accounting presentation can materially affect perceived progress. Watch for:
- LOIs or MOUs recognized or emphasized in guidance without clear, binding contractual evidence.
- Revenue booked via JVs where the company’s share of EBITDA is ambiguous; look for cash distributions and minority protections.
- Capitalized development costs and when they switch to production revenue — this affects near‑term free cash flow.
Action: read the notes to financial statements, revenue recognition policy and JV agreements in full. Reconcile management statements with audited disclosures.
Step 7 — Valuation frameworks by sub‑sector (updated comparables)
Valuation remains model‑driven. Use comparables cautiously because multiples compress as projects mature and financing becomes standardised.
- Electrolyzer manufacturers: use EV/EBITDA when positive EBITDA exists; for pre‑profit names, model $/kW achievable at scale and margin path with sensitivity to raw‑material costs.
- Project developers: DCF the contracted cash flows per project and value corporate overhead separately; value optional/merchant volumes conservatively.
- Integrated industrials: treat hydrogen investment as a return on capital deployed within core operations; model uplift to unit economics and payback periods.
Action: prepare a downside DCF that assumes higher electricity costs and partial subsidy withdrawal; test how much upside is sensitive to a single large contract failing.
Step 8 — Build a checklist of catalysts and time horizons (updated)
Projects span multiple years. Important catalysts to calendarize:
- Near term (3–12 months): financial‑close announcements, first commercial electrolyzer deliveries, third‑party verification that triggers tax credits.
- Medium term (12–36 months): first hydrogen shipments, commissioning of >10 MW plants, auction results from national hydrogen banks.
- Long term (36+ months): scale manufacturing ramp, replication of project economics across geographies, pathway to positive FCF at corporate level.
Action: attach probabilities and expected dates to each catalyst and use them to stage position sizing.
Step 9 — Construct a practical screening rule set (tighten filters)
To build a tradable watchlist, use objective filters then deep‑dive survivors:
- Market cap > $250m for retail liquidity (adjust for your trading strategy).
- At least one binding offtake or procurement contract representing >20–30% of next‑three‑year revenue for developers; for manufacturers, backlog >$50–75m with defined delivery windows.
- Cash runway >12 months at current burn or evidence of committed project financing.
- Published performance data for deployed electrolyzers or third‑party test verification.
- Clear disclosure of subsidy eligibility and evidence of award / registration where needed.
Action: run these filters in your screener and maintain a short list for rolling due diligence updates.
Step 10 — Position sizing, risk management, and trade execution (practical rules)
Green hydrogen investments remain binary in many cases. Practical rules:
- Initial allocation per name: 1–4% of portfolio by default; increase only after repeatable revenue delivery and demonstrated financing capacity.
- Stagger buys to milestones: initial position on contract or JV formation, add on commissioning/first hydrogen offtake.
- Set explicit downside triggers: loss of financial close, cancellation of a major offtake, or materially missed manufacturing milestones.
- Consider hedges: short correlated names if you want to express technology risk separately from project execution risk.
Common mistakes to avoid (updated)
- Treating LOIs or MOUs as firm revenue without legal confirmation.
- Using single‑year average power prices instead of hourly/seasonal curves.
- Ignoring warranty details and stack replacement costs that can double O&M over a decade.
- Overweighting publicity (announced partnerships) versus demonstrable finance and delivery milestones.
Pro tips
- Model hourly operation for at least one representative year; use public ISO/market price CSVs and simple dispatch logic to estimate realistic capacity factors.
- When evaluating electrolyzer makers, translate order backlog into expected production capacity (MW) and then into potential revenue at realistic per‑kW ASPs and gross margins.
- Follow utility and corporate PPA markets — a firmed renewable PPA materially improves LCOH and can be a stronger value driver than headline subsidies.
Where to find primary data (updated)
- Company filings and investor presentations for binding contracts, backlog and warranty terms.
- Government and program portals (national auction results, production tax credit guidance). Check agency websites for award lists and qualification guidance.
- ISO/PX price data (CAISO, PJM, EPEX SPOT, Nord Pool, etc.) for regional hourly power price curves.
- Technical benchmarks from IEA, IRENA and industry test houses for electrolyzer efficiency and degradation—use these as sanity checks.
Practical example: LCOH sensitivity (hypothetical)
Use a simple illustrative case to show sensitivity to electricity price and the effect of a per‑kg subsidy (hypothetical values):
- Electrolyzer CAPEX (installed): $800/kW
- Efficiency: 50 kWh/kg H2
- Representative capacity factor: 5,000 hours/year
- Electricity price scenarios using hourly averages: low, base, high
Electricity cost per kg = (kWh/kg) × (electricity $/kWh). At 50 kWh/kg: low grid price produces low electricity cost per kg, while high grid price makes LCOH materially higher. Then layer a per‑kg subsidy (modeled explicitly as an after‑tax cash flow arriving quarterly or annually) to see the net LCOH to the seller. Always test delayed subsidy receipt and partial award risk.
Red flags to watch (refined)
- Large announced targets supported only by MOUs/LOIs rather than signed offtake and financing documents.
- Repeated equity dilution without corresponding progress toward financial close or deliveries.
- Opaque JV arrangements where majority economics flow to a related party.
- Dependence on a single subsidy program that is not yet awarded or has governmental approval risk.
Putting it together: a repeatable research template (updated)
Create a one‑page brief for each stock. Include:
- Business model, revenue mix today vs. 36 months out, and the unit economics per kg of hydrogen.
- Top 3 catalysts and 3 downside risks with probability and timing.
- Hourly LCOH sensitivity table covering power‑price and subsidy outcomes.
- Balance sheet runway, committed financing, and dilution risk over next 24 months.
- Valuation summary (base and downside DCF and a simple per‑kW or per‑kg sensitivity).
This discipline turns press releases into measurable investment inputs and helps you size positions for the real, multi‑year delivery timeline of green hydrogen projects.
Conclusion
Green hydrogen remains a structural decarbonization pathway but the market has matured: projects are being financed and commissioned, policy mechanisms are more explicit, and hourly power dynamics are a critical differentiator. That evolution makes stock selection more grounded in data — but also more granular. Use the updated 10‑step checklist above to translate announcements into provable economics, watch financing and subsidy realization closely, and size positions to reflect long timelines and binary project outcomes.
FAQ
How should I model subsidies when calculating LCOH?
Model subsidies explicitly as per‑kg or per‑MWh cash flows with timing and conditionality. Do not assume instant full realization: allow for verification lags, audit risk and phased payments. Where a subsidy is awarded by competitive auction, model the probability of receiving the award and the timing of cash flows conservatively.
What is the most important single variable for green hydrogen economics?
Electricity price and its hourly profile are typically the dominant variable. For flexible projects, capture value from operating during low‑price periods and potentially earning grid services. Without access to low‑cost, firmed renewable power, many projects struggle to meet competitive offtake prices.
Can electrolyzer manufacturers become profitable before project developers?
Yes — manufacturers with large, recurring equipment sales and service revenues can scale faster and reach positive margins earlier than developers, who face high upfront capex and long project timelines. But manufacturers face their own risks: supply‑chain constraints, price competition and warranty liabilities.
How do I assess counterparty risk for offtake contracts?
Check the counterparty’s credit rating or balance‑sheet strength, parent guarantees and whether the contract contains price‑review or termination clauses tied to subsidy changes. Bankability for lenders (i.e., whether the offtake would qualify for project finance) is a practical litmus test.
Where should I look for early warning signs of project failure?
Watch for missed milestone filings (construction permits, grid‑connection acceptance), repeated financing pushouts, changes in key supplier agreements, and disclosures that LOIs were downgraded or terminated. These often precede material valuation write‑downs.